20240401第七周 學習心得:
一、Visual studio code 安裝過程
1.下載 visual studio code for win10 然後安裝,在CMD底下安裝 pandas, matplotlib。
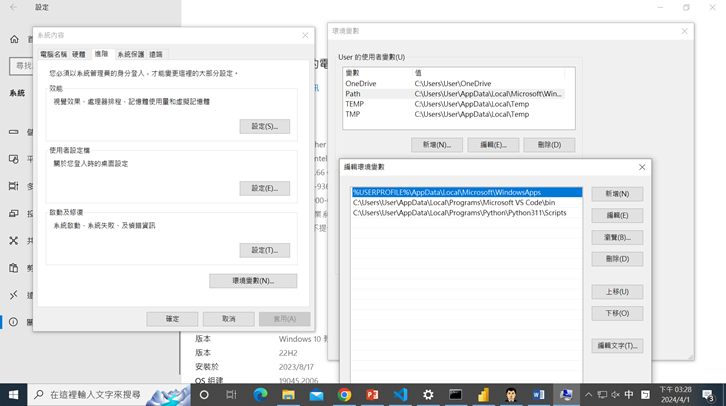
2.PYTHON 路徑設定:到系統的環境變數將C:\Users\User\AppData\Local\Programs\Python\Python311\Scripts 貼上
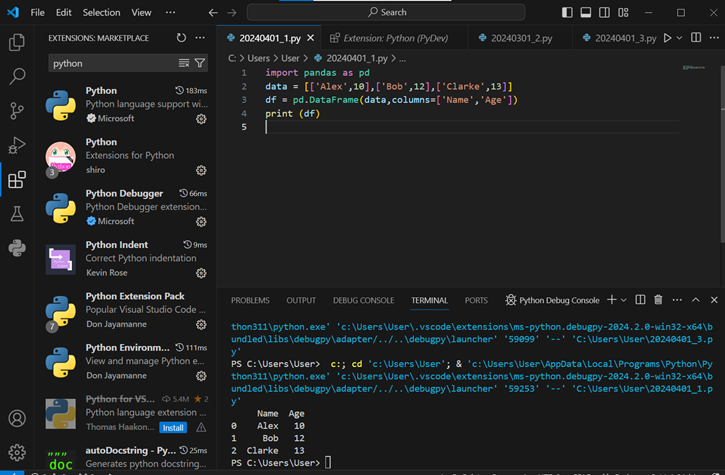
3.執行程式
import pandas as pd
data = [['Alex',10],['Bob',12],['Clarke',13]]
df = pd.DataFrame(data,columns=['Name','Age'])
print (df)
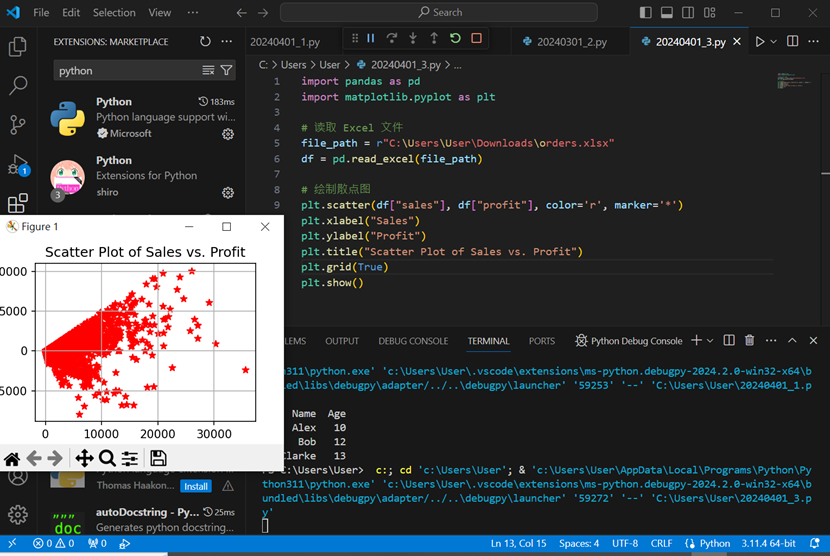
執行程式: 在 visual studio code 劃出 scatter
import pandas as pd
import matplotlib.pyplot as plt
# 读取 Excel 文件
file_path = r"C:\Users\User\Downloads\orders.xlsx"
df = pd.read_excel(file_path)
# 绘制散点图
plt.scatter(df["sales"], df["profit"], color='r', marker='*')
plt.xlabel("Sales")
plt.ylabel("Profit")
plt.title("Scatter
Plot of Sales vs. Profit")
plt.grid(True)
plt.show()
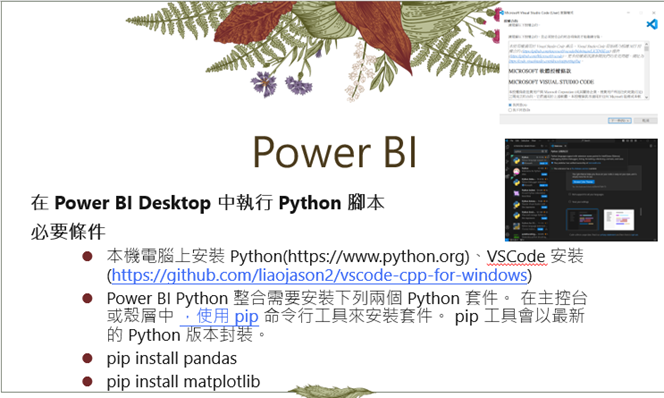
Power BI 必須安裝的 PYTHON模組
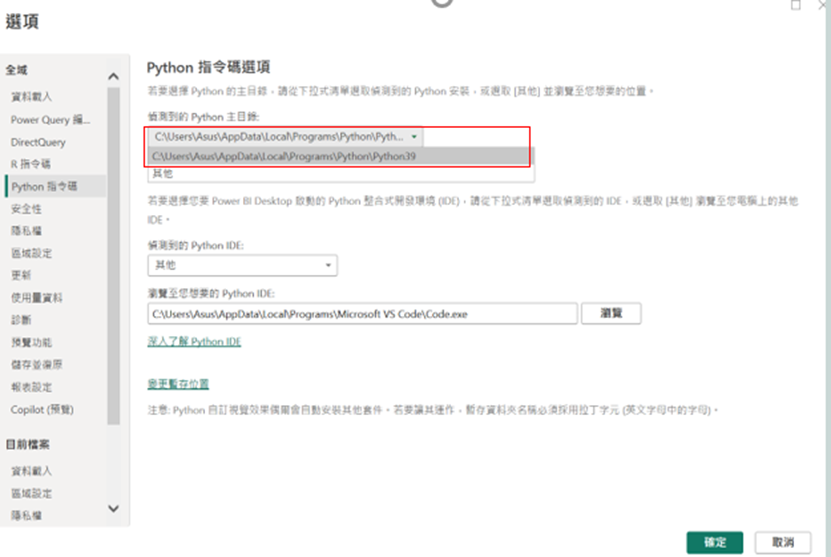
在 Power BI 中啟用 Python 腳本
在選取
[檔案>選項和設定>選項>Python 腳本]
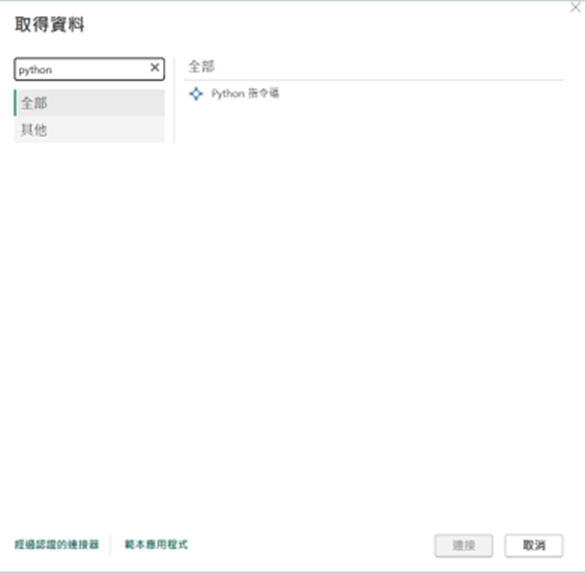
在 Power BI Desktop 功能區的 [ 首頁 ] 群組中,選取 [ 取得數據]
在 [取得數據] 對話框中,選取 [其他>Python 腳本],然後選取 [連線]。 Power BI 會使用最新安裝的
Python 版本作為 Python 引擎。
在 [ Python 腳本] 畫面上,將您的 Python 腳本 貼到 [腳本 ] 字段中,然後選取 [ 確定]。
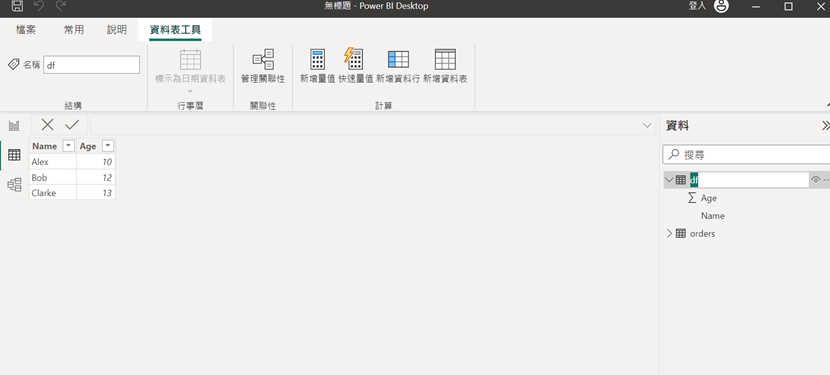
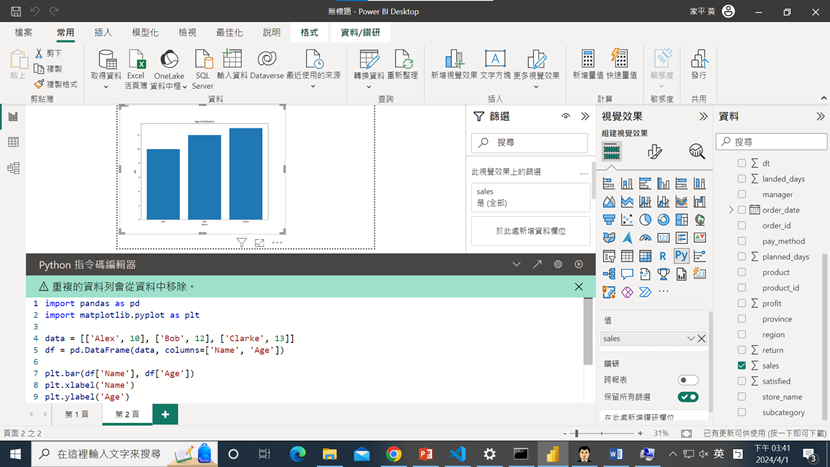
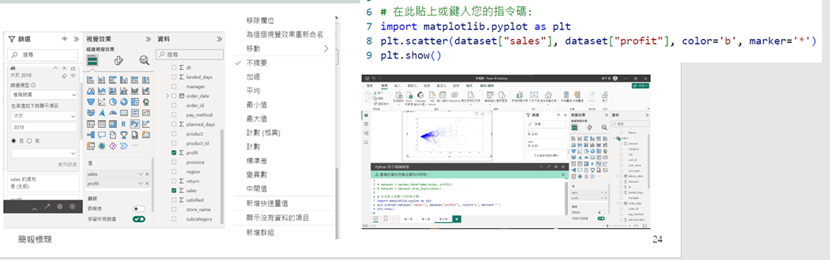
在POWER BI 劃出SCATTER
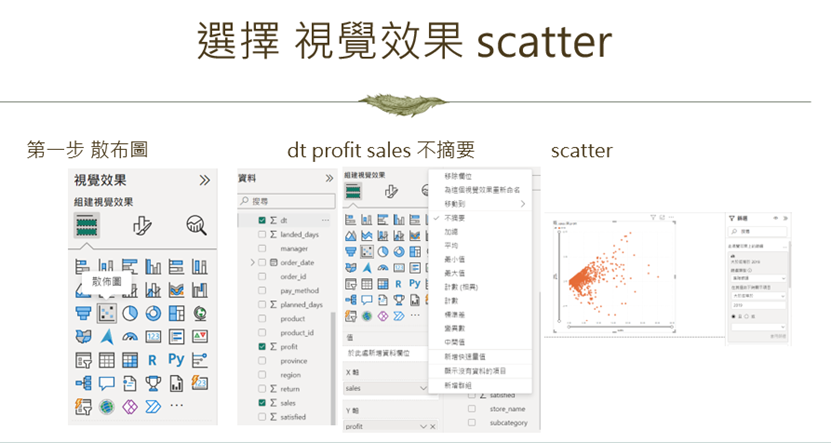
PYTHON 視覺效果